Plotting support is only available in the graphical GNOME version. All plotting accessible from the graphical interface is available from the Create Plot window. You can access this window by either clicking on the Plot button on the toolbar or selecting Plot from the Calculator menu. You can also access the plotting functionality by using the plotting functions of the GEL language. See Chapter 5, GEL Basics to find out how to enter expressions that Genius understands.
To graph real-valued functions of one variable, open the Create Plot
window. You can also use the
LinePlot function
on the command line (see its documentation). And by the words line plot, we mean plots in the plane,
as opposed to surface plots, which are in three dimensions.
Once you click the Plot button, a window opens up with some notebooks in it. You want to be in the Function line plot notebook tab, and inside you want to be on the Functions / Expressions notebook tab. See Figure 4.1, “Create Plot Window”.
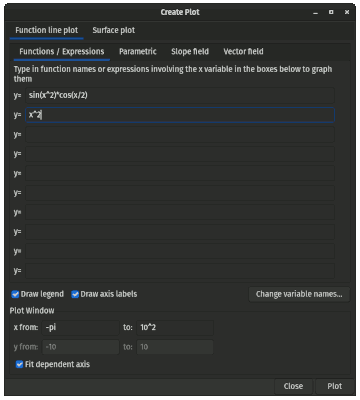
Type expressions with x as
the independent variable into the textboxes. Alternatively you can give names of functions such as
cos rather then having to type cos(x).
You can graph up to ten functions. If you make a mistake and Genius cannot
parse the input it will signify this with a warning icon on the right of the text
input box where the error occurred, as well as giving you an error dialog.
You can change the ranges of the dependent and independent variables in the bottom
part of the dialog. In the boxes for the ranges, simple expressions are allowed,
such as 2*pi or 10^3.
The y (dependent) range can be set automatically by turning on the Fit dependent axis
checkbox.
The names of the variables can also be changed.
Pressing the Plot button produces the graph shown in Figure 4.2, “Plot Window”.
The variables can be renamed by clicking the Change variable names... button, which is useful if you wish to print or save the figure and don't want to use the standard names. Finally you can also avoid printing the legend and the axis labels completely, which is also useful if printing or saving, when the legend might simply be clutter.
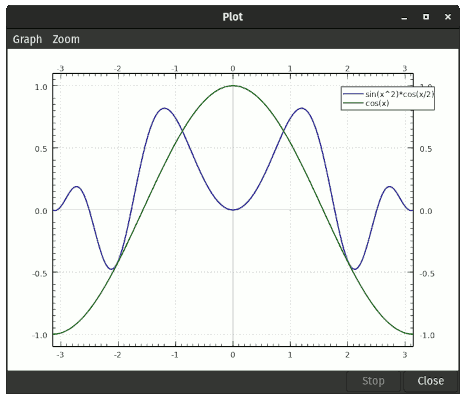
From here you can print out the plot, create encapsulated postscript or a PNG version of the plot or change the zoom. If the dependent axis was not set correctly you can have Genius fit it by finding out the extrema of the graphed functions.
For plotting using the command line see the documentation of the
LinePlot function.